Texas Property Insider- Austin Real Estate and Texas Coastal Real Estate Blog

Welcome to Texas Property Insider. The purpose of this blog is to provide accurate and helpful information about market trends and issues important to property owners in Central Texas and on the Texas Coast. You hear a lot of talk out there. You see the statistics, read the stories in the newspaper and you see practitioners regurgitate those same stories and statistics. There is more information available then ever before. But why is it, even after all of the stories and pundits have had their say, you still feel you can’t grasp what’s really happening in the real estate market?


There is a lot more to it than simple statistics and market info. These numbers are helpful and vitally important, but if taken at face value they can be misleading, even deceiving. As Mark Twain once said, “There are lies, damned lies and then there are statistics.” I created this blog to pull back the curtain on Texas real estate, interpret the market information and present it to you in a format that is both pithy and easy to digest.

Tuesday, May 17, 2011

Austin’s Rosedale Neighborhood Update…


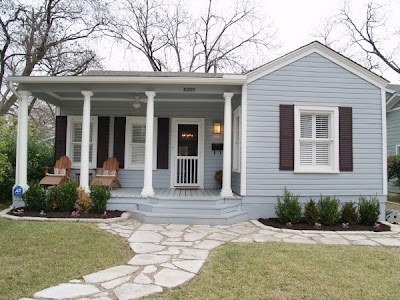
What’s going on in Rosedale? Some of you know others may not…what is Rosedale and where is it? - Rosedale is a great little neighborhood in north-central Austin near MoPac Highway. It is bounded by Lamar Boulevard to the east, Shoal Creek to the west, Hancock Drive to the north, and 38th Street to the south. Rosedale contains some 1,200 households, as well as a park, a library, and a medical complex nearby.

Built on farm and dairy land during the late 1800's and early 1900's, Rosedale has preserved many of its original houses and architecture. The large trees which provide shade to the neighborhood are legacies left by residents from the early 1900s. Rosedale, while paying homage to the past, has a new vibrancy as well. New homes, remodels and businesses make Rosedale a neighborhood firmly rooted in the present without loosing it’s historical charm.


One of the central features of the Rosedale neighborhood is Ramsey Park, found between 42nd and 44th streets on Rosedale Avenue. This 5-acre park has a swimming pool, tennis and basketball courts, playground, and numerous picnic tables. Ramsey Park is a popular place for residents to gather, exercise or relax.

The Rosedale community is very active, led by a well-organized neighborhood association. Formed in the 1970s following successful efforts by area residents to stop the closure of neighborhood Fire Station #12, the Rosedale NA sponsors neighborhood activities, advocates local positions on city issues, and works to promote the beauty and safety of Rosedale.

Alright here’s the deal- There are currently 16 homes available in the Rosedale neighborhood with 7 other under contract. Over the past 3 months 6 homes have sold. With this rate of absorption there is 8 months of inventory. Equilibrium is 6 months, so this number is a little high, but not bad.

Sales in Rosedale were a bit sluggish in December and January with 4 and 3 respectively. The current environment is much brighter. 7 homes under contract is really exciting, especially for the size of this neighborhood. This shows a sharp increase in activity and looks like it could indicate a promising summer. The average list to sale price is a very solid 95% (original list to sale is also 95%). The homes under contract found their buyers on average in 25 days (the homes that sold did so in 25 days!)! Buyers are getting back into the market and they are not wasting time. Rosedale sellers have to be pleased and buyers know that the good inventory goes fast.

This bodes well for Rosedale and the summer should be busy.

Thursday, April 28, 2011

Austin rents will rise, options in short supply...

Austin continues to be above rental market saturation. What does that mean? Rentals are hard to find...and expensive. Click the article to read more.

Wednesday, April 27, 2011

Very interesting article about the economy and the affluent...

Hi All,

I just read this article posted by the Institute for Luxury Home Marketing. It is a very interesting article about current trends with the affluent in America. It's always interesting to hear about that market, because it plays such are large roll in our economy (affluent, business owners etc.). I found it interesting that they are more likely, as a group, to purchase big ticket items soon; like a vacation home etc. Remember the "pretend and extend" is coming to an end and we are starting to see signs of inflation. When inflation hits, it will hit big! Solid assets continue to be a great way to protect and build wealth. If you thinking about investing or parking some money in a vacation home or rental unit call me, I would love to chat with you. 512.921.3111

Take care and enjoy the article.

Best,

Marcus Cox


Half the affluent opting-out of social media

Posted: 26 Apr 2011 01:45 PM PDT

Anti-social or just busy with other things, half of the affluent say they do not participate in any type of social media according to the Spring 2011 Affluent Market Tracking Study conducted by The American Affluence Research Center.

Some highlights from the study:

  • In contrast to the March general Consumer Confidence Index of The Conference Board, which fell over 10% to the low levels last seen in Fall 2010, the affluent, who account for about half of all consumer spending, report a better outlook for the economy and their personal spending plans.
  • Spending plans for all 17 products and services tracked by these surveys are much stronger than in the Fall 2010 survey.
  • There is also improvement in the plans to make major expenditures such as for a new auto, a cruise, and a vacation home.
  • While 65% of the affluent own a smart phone or a tablet (or both), the remainder have regular access to a computer. Half of the affluent say they do not participate in any type of social media.
  • Among those that do participate in social media, only a quarter say they use social media to receive regular communications about product and related information from a manufacturer or retailer. In other words, only 12.5% of the affluent say they are using social media to receive regular product information from a manufacturer or retailer. This relatively low number (12.5% of the affluent) may be surprising given all the amazing statistics being circulated by various research and traffic tracking companies about the volume and growth of e-commerce, the ubiquitous mobile devices, and the urgent emphasis to invest time and money into various forms of mobile apps and promotional activities online through proprietary sites and social media. It is important to understand who will actually be reached through mobile devices and social media (and whether the ROI is reasonable), what technology is needed to be compatible with the various different mobile and other receiving devices, and who might be missed if communications are limited exclusively to these channels.
  • About 59% of the affluent say they are not familiar with the concepts of private residence or destination clubs. Concept familiarity, which is essentially the same as in 2007, is strongest among the younger (59 and under), higher income, and higher net worth groups.
  • About 10% of the affluent say they will seriously consider acquiring access to a vacation home during the next 12 months. Plans to make an acquisition increase as age declines, income increases, and net worth increases. About 2.9% are considering two types of vacation home acquisition. Wholly-owned homes are the most favored type of vacation home access. Wholly-owned homes used primarily on a seasonal basis are more popular than those used frequently throughout the year. The only exceptions are the 50 to 59 age group, the under $200K income group, and the lowest net worth group.

Overall, this is good news. Among the successful, outlooks are more positive and spending plans are up.

Remember that insights based on good research and data can help you identify opportunities and threats and adjust your marketing strategies and plans accordingly.

Sunday, April 17, 2011

Friday, April 15, 2011

SoCo / South Congress Austin Real Estate Update...


Good afternoon and happy Friday!

Ok, I have had several clients interested in the South Congress/SoCo area in Austin. Things have been changing in this area so I thought you all might like to hear about the latest and the greatest.

Here's the deal: There are currently 49 active homes available in the South Congress area with 21 others under contract. Over the past 3 months 21 homes have sold. At this rate of absorption there is 7 months of inventory. Equilibrium is 6 months, so these numbers are not particularly high, but does show availability in the market place.

I am pleased with the number of homes under contract. This shows that activity in this area has started to increase. Sales in SoCo were somewhat sluggish in November and December of last year. 6 Homes sold in November with an average days on market (DOM) of 91 days. The original list to sales price (OL/SP) was an unimpressive 87.32%. This indicates that sellers were forced to be more flexible in pricing in order to find real buyers. December saw improvement; 7 homes sold with a OL/SP of 90.49%, but the DOM figure increased to 104 days.

OL/SP for the past few months is over 90% and DOM has been a fresh 73 days...yeah, that's nice. Over the past week or two new listings have started to hit the market. Many of the markets in Austin have been waiting for new homes to hit the market as much of the sluggish inventory has been on the market for some time. The "new blood" in the market signifies that sellers are more comfortable with marketing their homes and buyers will certainly welcome the new options. Additionally, 21 pending homes is an excellent sign for sellers in the SoCo area, especially as we get closer to summer. The sharp increase in number of homes in escrow shows that Austin's South Congress area is waking up for the summer buying season. I anticipate the inventory will start to decrease over the next months as more buyers pull the trigger. As more homes sell, sellers will be more inclined to list their homes so this churn should keep numbers closer to equilibrium rather than a sharp drop in supply.

So, things look good for South Congress as we move closer to the summer. No doubt people will start to spend more time outdoors, at First Thursdays and enjoying Austin, for the popular SoCo we know what that means...more activity across the board.

Thanks for reading...now it's time for dinner, cocktails and the sunset!

Marcus Cox


More about me:
www.marcuspeacecox.com
More about my company:
www.avalaraustin.com

Tuesday, April 12, 2011

Stop Paying attention to month over month comparisons...


Hi Guys,

I hope all is well with you. Today we are going to bust open a commonly misunderstood statistical favorite. That would be the monthly performance comparisons based on the year, month over month comparisons. (ie. Sales June 2010 are up 32% compared to June 2009.)

I'll spoil the ending for you...they are meaningless.

You will often see these numbers reported in the newspaper or in real estate updates written by title companies or agents. These figures are interesting and they do fill up space, but at the end of the day the actual value of these figures is quite low. Real estate is all about trends and the pushing or pulling of interest rates, consumer confidence, the economy on the whole, local economic indicators, neighborhood, price range etc. So, because of these factors what happened last June really has no bearing at all on what happens this June and thus the numbers are cotton-candy (feel good, but no nutrition) rather than a secret weapon for the consumer.

How many people like looking at real estate in the rain? No one. Nobody likes looking for homes in the rain. Something as innocent as two weeks of rain during a busy buying season can throw numbers off. It is very important to look past the stats and try to discover the real meaning.

"Sales are up" or "sales are down" make for great headlines, but they are only meaningful if compared to applicable market data. Thus, if sales this month are up over last month this could be an indicator that the market is changing. (POP QUIZ: What are the three indicators that a market is changing? Answer...days on market, months inventory and list to sale price ratio) But, sales differences from a year ago fail to show any trends of a heating or cooling market. The figures do not show what has happened between now and then.

So...when your looking at real estate statistics be sure to look past the month over month comparisons and focus your attention on what the market did last month and the month before. Also, remember in the Austin market, that real estate has been so local that one street can be hot and another just around the corner is not. With this type of environment trends even in a particular zip-code can be deceiving.

Talk to you all soon!

Marcus

Sunday, April 10, 2011

What is real estate like in your neck of the woods?

Hi All,

We have a lot of readers from all over the Texas real estate spectrum. Are you curious about what's happening in your neighborhood in central Texas or on the coast? Email me and I will be happy to post an update on your specific area.

Looking forward to helping!

Best,

Marcus

Thursday, April 7, 2011

North 1B Luxury Comps – Highland Park West, Balcones & Mount Bonnell April 7, 2011


(Area defined by: North of 35th St., West of MoPac, East of Lake Austin & South of 2222)

- There are currently 26 luxury homes available in this area with 7 others currently under contract. Over the last 3 months 8 luxury homes have sold. At this rate of absorption there is 10 months worth of inventory. Things were somewhat active last fall in 1B north and activity increased during the holidays and early in the year. Since that time the pace has slowed. However, 7 pending homes is a healthy sign and shows a rate of increasing activity, and I anticipate this higher activity to continue.

The activity in the $500k to $999k range accounts for almost 90% of the areas luxury sales, this is higher than normal. There are currently 13 homes available but only 2 of the 7 pending homes is in this price range. Over the last 3 months 7 homes have sold between $500k and $999k. With this rate of absorption there is 5.6 months of inventory, which is significantly better than the ULRA luxury market.

The activity in the ULTRA luxury market, $999 and up, has been very slow over the past three months but we have seen much more activity recently (5 pending homes is a strong indicator). There are currently 14 active homes available and 5 pending sales in this market. Over the last 3 months 1 ULTRA home has sold yielding an absorption rate of .33 homes a month. At this rate there is currently 42 months of inventory. We have seen these buyers start to enter the market because jumbo rates have been so attractive and all signs point to a stronger real estate market. The very negative absorption rate is more of a statistical number, and doesn’t accurately show market forces. 5 pending sales shows strong buyer activity in this market and once these close the absorption rate will be much more favorable.

Final Thoughts: The activity below $1 million has been solid and accounts for almost 90% of the sales. The ULTRA market has been very slow until recently. Luxury sellers have held firm on their pricing and this indicates a stronger market (last fall much of the luxury market was discounting their homes to find real buyers). The market data is somewhat skewed because of the high number of pending sales that have yet to close. As those homes close the numbers will be much more favorable, but I will be interested to see if 1B can keep up this pace. My though is activity in the $500 to $999 range will increase and the $1 million + activity will stay solid but slow some in the next months.


Best,

Marcus

Sunday, April 3, 2011

More good news for Austin?

Hey Guys,
More good news for Austin, as PayPal considers adding 1000 new jobs in the Austin area. This is another example of Texas', and to a greater extent, Austin's popularity among businesses and individuals alike. Low taxes, no state income tax, a healthy job & real estate market, a highly educated populous and fabulous weather makes Austin a great choice. Take a look at the Austin Business Journal article for more information: PayPal
Have a great day!!!

Best,
Marcus

Tuesday, March 29, 2011

New real estate lifestyle site... workingtoomuch.com!!!!


Hey All!

I am happy to announce that I launched a new real estate website geared for second homes, ranches and legacy properties. I would love to hear your thoughts, and of course, if you're looking for a second home, beach house or ranch call me; I would love to help.


Thanks and have a great night!

Best,

Marcus

Monday, March 21, 2011

Homes sales volume, median price consistent from year-to-year in February

Austin Board of REALTORS® releases February 2011 real estate statistics

Text Box: February 2011 Statistics  $271,752,784 – Total dollar volume of single-family properties sold, statistically unchanged from February 2010.  $193,000 – Median price for single-family homes, two percent more than February 2010.  1,112 – Single-family homes sold, statistically unchanged from February 2010.  98 – Days on market, 27 percent longer than February 2010.  2,335 – New single-family home listings on the market, 24 percent less than February 2010.  8,605 – Active single-family home listings on the market, eight percent less than February 2010.  1,543 – Pending sales for single-family homes, 11 percent less than February 2010.AUSTIN, Texas – March 21, 2011 – According to the Multiple Listing Service (MLS) report released today by the Austin Board of REALTORS®, 1,112 single-family homes were sold in the Austin area in February 2011, a figure that is statistically unchanged from February 2010.

In the same time period, the median price for single-family homes in Austin was $193,000, up two percent from February 2010, and homes spent an average of 98 days on the market, 27 percent longer than February 2010. In addition, new listings were down 24 percent in February 2011 compared to February 2010 and active listings were down eight percent.

“In terms of home sales volume, February 2011 looks much like this month last year. However, there are a few key differences,” said Judith Bundschuh, Chairman of the Austin Board of REALTORS®.

Chairman Bundschuh continued, “Fewer homes were on or entering the market in February. This could mean buyers may encounter more competition for properties heading into the summer selling season. At the same time, increases in the days on market means sellers should prepare to be patient if they want to earn full value for their properties.”

In February 2011, pending sales for single-family homes were down 11 percent when compared to February 2010. Chairman Bundschuh explained, “The market is still feeling the effects of the home-buyer tax credits. As we compare last year when incentives were available to this year without the tax credits, we see that month-to-month comparisons are still being influenced by the artificial stimulus the tax credits provided.”

Additionally, leasing activity in the Austin area increased in February with 1,117 properties leased, up five percent from the same month last year. The median lease price in February 2011 was $1,200, nine percent more than in February 2010.

Tuesday, February 22, 2011

Austin area home sales volume up 14 percent in January compared to 2010


Some great news from ABOR. I am very encouraged by the signs of strength shown by the real estate market in Austin. I have seen an nice increase in activity across all price ranges over the past couple of months. Enjoy... Marcus


Austin Board of REALTORS® releases January 2011 real estate statistics

AUSTIN, Texas – February 21, 2011 – Sales of single-family homes in the Austin area were 14 percent higher in January 2011 than January 2010 with 975 homes sold, according to the Multiple Listing Service (MLS) report released today by the Austin Board of REALTORS®.

In the same time period, the median price in Austin was $190,000, up six percent from January 2010; and homes spent an average of 93 days on the market, 11 percent longer than January 2010. In addition, new listings were down 14 percent in January 2011 compared to January 2010 and active listings were down five percent, indicating a decreasing inventory of homes.

“The latest figures show that we are seeing the economic recovery continue in Austin,” said Judith Bundschuh, Chairman of the Austin Board of REALTORS®.

Chairman Bundschuh continued, “Looking at these results, sellers should be encouraged that demand and prices are strong, but they should expect to be patient to achieve full value. Buyers should know that fewer listings combined with increased demand could mean they will encounter more competition for properties.”

Monday, January 31, 2011

Texas Public Beaches vs. Private Property Rights...


Hi all, I just found an article by Gabriel Lopez in the most recent issue of Texas Realtor. It sheds some light on the new Supreme Court rulings on Texas beaches, public easements and private property owners. It is definitely worth the read. Enjoy...
Marcus

A new line between private property and the beach?
Court case shores up property rights for coastal properties.

by Gabriel Lopez

The Texas Supreme Court recently issued an opinion
that slightly waters down the powers the state of Texas has to enforce the Open Beaches Act. If you sell beachfront property or work with buyers interested in acquiring property at the coast, you’ll want to know about this change.

Just how do you define beach?
The Open Beaches Act, passed in 1959, sought to codify rights already granted by earlier court rulings. The act prohibited anyone from creating, erecting, or constructing any “obstruction, barrier, or restraint” that would interfere with the unrestricted right of the public to access Texas beaches (where the public had acquired a right of use or easement).

While inland easements are easy to define by their static metes and bounds, anyone who has ever gone to the beach knows that, depending on the time of day, there may be more or less beach to use. There’s also a distinction between wet and dry beaches.

Wet beaches are the zone that extends from low tide to high tide. These have always been considered public property held in trust for the people of Texas. A dry beach is considered the area between the high tide and the vegetation line. In Texas, dry beaches have remained open to the public by virtue of continuous use for as long as anyone can remember. The recent court case concerns dry beaches.

A little iced-tea analogy
If you, like me, have a fondness for sweetened iced tea in summer, you can appreciate having the perfect mix of ingredients in your glass. Any iced-tea drinker worth his weight in sugar (or NutraSweet or Extra or even Splenda) knows that balancing the tea, the melting ice, and the sugar is a skill just short of alchemy.

Sometimes you have just the perfect mix and, while you’re not looking, an oblivious server—like I was during college—refills your glass. Everything changes.

Oceanfront beaches are a little like that iced tea. They change all the time. The tide and vegetation lines shift. Beachfront property lines retract or extend when previously dry lands become submerged by the surf or dry out after being submerged. That makes public beach easements dynamic as well.

Most boundary shifts are gradual, like the ice melting in the tea. So the law does not require the state to constantly reestablish the easements each time the boundary moves. This is how public easements work along a beach. Gradual changes are accounted for, and equilibrium is maintained between private property and public easements.

What happened on the beach in Galveston

Sometimes, though, like the perfect glass of tea disrupted by a clueless server, a beach undergoes a sudden, drastic change. That’s what happened to Carol Severance, who owned several beachfront homes along Galveston’s West Beach. Hurricane Rita devastated her investment properties and moved the vegetation line dramatically up the shore.

After the storm, the entirety of one house was now seaward of the vegetation line. This made her property subject to the public easement. The state was seeking to use the Open Beaches Act to forcibly remove any structure that came to be located on what was now considered the public beach. That included the house Severance owned on Kennedy Drive.

The end of the world as we know it? Hardly…
It is extremely difficult to balance the public interest in the enjoyment of public beaches with the almost sacrosanct ability for private-property owners to exclude others from their property. Imagine if every Tom, Dick, and Harry could waltz onto your property, set up a towel, and cavort on your lawn.

The Texas Supreme Court ultimately decided that although a property owner can potentially lose property if it becomes part of the wet beach or is submerged after a natural disaster, it is not reasonable to suddenly encumber an entirely new portion of a landowner’s property that was not previously subject to a public easement.

There are those who would have you believe this will spell the end to public beaches in Texas. This is a knee-jerk reaction and a wild exaggeration. This ruling will only apply in an extremely limited set of circumstances after a natural catastrophe. The court also held that if the state wanted to preserve the public easement along Severance’s property, it could (gasp) pay for it.

To see the article click here.

To read more about the Supreme Courts ruling and opinions click here.
Interested in Texas Coastal Real Estate? click here.

Thursday, January 27, 2011

Market for vacation homes is on the rise...


The Wall Street Journal just recently featured an article discussing the growth in the vacation home - second home real estate markets. The article is very interesting, but does not feature Texas coastal real estate. We have a seen a pretty significant increase in activity on the Texas Coast since September 2010, as many buyers/investors are comfortable with the economic climate and looking for an opportunity to enjoy the beach and safely park money. Click the link below for the full article. Enjoy...


Vacation Home Article


Photograph By: King Lawrence - www.kinglawrence.com

Thursday, January 6, 2011

Austin Real Estate Market Update: Pemberton Heights/Enfield & Brykerwoods...


We have started to see some interesting things in the Pemberton Heights, Brkyerwoods, Enfield area of Austin. I went in and did a market breakdown, enjoy...
East 1B Luxury Comps – Enfield, Pemberton Heights and Brykerwoods January 6, 2011

(Area defined by: South of 35th St., West of Lamar, East of MO-Pac & North of Enfield)

- There are currently 20 luxury homes available in this area with 3 others currently under contract. Over the last 3 months 11 luxury homes have sold. At this rate of absorption there is 5.5 months worth of inventory. Things were very slow last fall in Pemberton/Enfield. The 3 pending homes, while not an amazing number, still signifies a rate of increasing activity, and I anticipate this higher activity to continue.

The activity in the $500k to $999k range accounts for more than 60% of the areas luxury activity, which is not surprising. There are currently 10 homes available but only one of the 4 pending homes is in this price range. Over the last 3 months 7 homes have sold between $500k and $999k. With this rate of absorption there is 4.2 months of inventory, which is better than the ULTRA luxury market.

The activity in the ULTRA luxury market, $999 and up, has been solid, especially considering the holiday season and new year. There are currently 11 active homes available and 2 pending sales in this market. Over the last 3 months 4 ULTRA homes have sold yielding an absorption rate of .75 homes a month. At this rate there is currently 14.6 months of inventory. Again, activity in the late summer was very slow and days on the market crept over 100 days on market. During that time frame several homes were purchased well below list price and original list/sale price dropped into the 70 percent range. Activity has increased in this area but Sellers appear to be discounting their properties in order to sell.

Final Thoughts: The activity below $1 million has been solid and accounts for over 60% of the sales. The ULTRA market has been more active as the winter season progressed but is still saturated at this time. The luxury sellers have had to discount their homes in order to find real buyers, this is also true for the <$999 market, but to a much lesser extent. The increased activity, especially during the winter holiday season is encouraging and I expect this market to continue to improve and the weather warms!
Best, Marcus